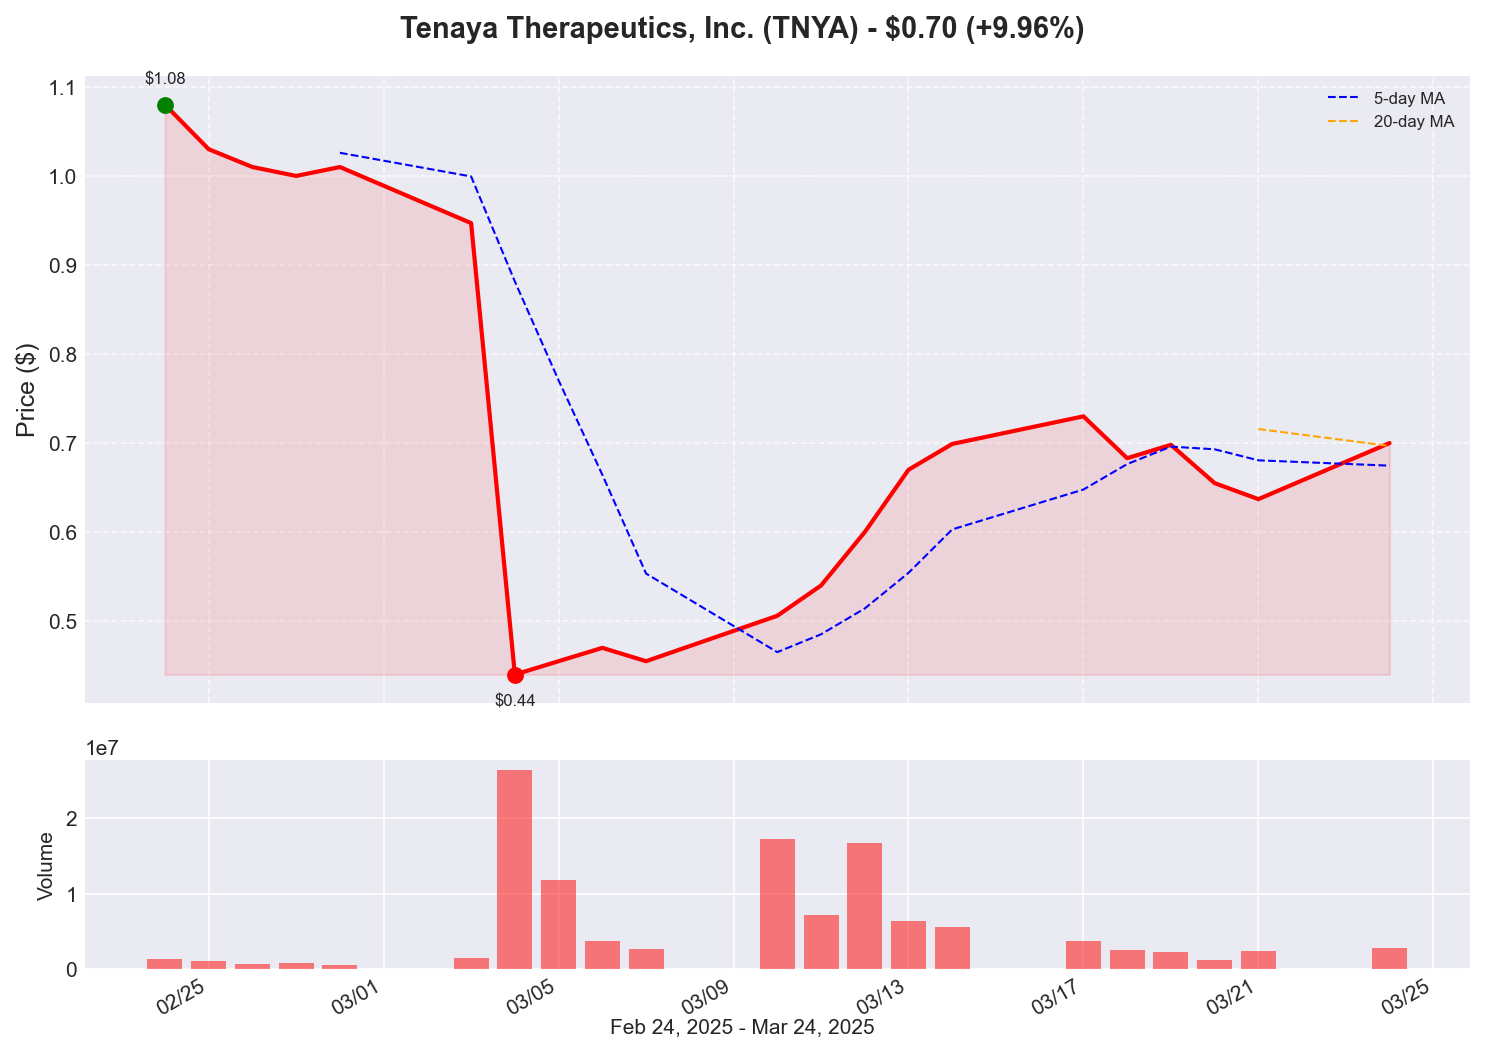
Tenaya Therapeutics, Inc. (TNYA) Analysis
Stock Overview
Volume: 0
Sector: N/A
Industry: N/A
Price Chart

Technical Indicators
Moving Averages
50-Day MA: N/A
200-Day MA: N/A
Relative Strength Index (RSI)
RSI (14): N/A
Support & Resistance
Support: $N/A
Resistance: $N/A
52-Week Range
High: $N/A
Low: $N/A
Fundamental Data
Market Cap
N/A
P/E Ratio
N/A
EPS
$N/A
Beta
N/A
Recent News
Tenaya Therapeutics Publishes Preclinical Data Demonstrating TN-201 Enhances Cardiac Function and Survival in MYBPC3 Cardiomyopathy Models
SOUTH SAN FRANCISCO, Calif., March 24, 2025 (GLOBE NEWSWIRE) -- Tenaya Therapeutics, Inc. (Nasdaq: TNYA), a clinical-stage biotechnology company with a mission to discover, develop and deliver potentially curative therapies that address the underlying causes of heart disease, today announced the publications of positive preclinical data for TN-201, the company's gene therapy candidate for Myosin-Binding Protein C3 (MYBPC3)-associated hypertrophic cardiomyopathy (HCM), in Nature Communications.
Read Full ArticleTenaya Therapeutics Announces Late Breaker and New Data Presentations at the American College of Cardiology's Annual Scientific Session
Late Breaker Oral Presentation to Include New Data from Cohort 1 of the MyPEAK™-1 Phase 1b/2 Clinical Trial of TN-201 Late Breaker Oral Presentation to Include New Data from Cohort 1 of the MyPEAK™-1 Phase 1b/2 Clinical Trial of TN-201
Read Full ArticleHistorical Performance
1 Day
N/A
1 Week
N/A
1 Month
N/A
3 Months
N/A
YTD
N/A
Historical Data
Last updated: March 24, 2025