ProShares UltraShort Semiconductors (SSG) Analysis
Stock Overview
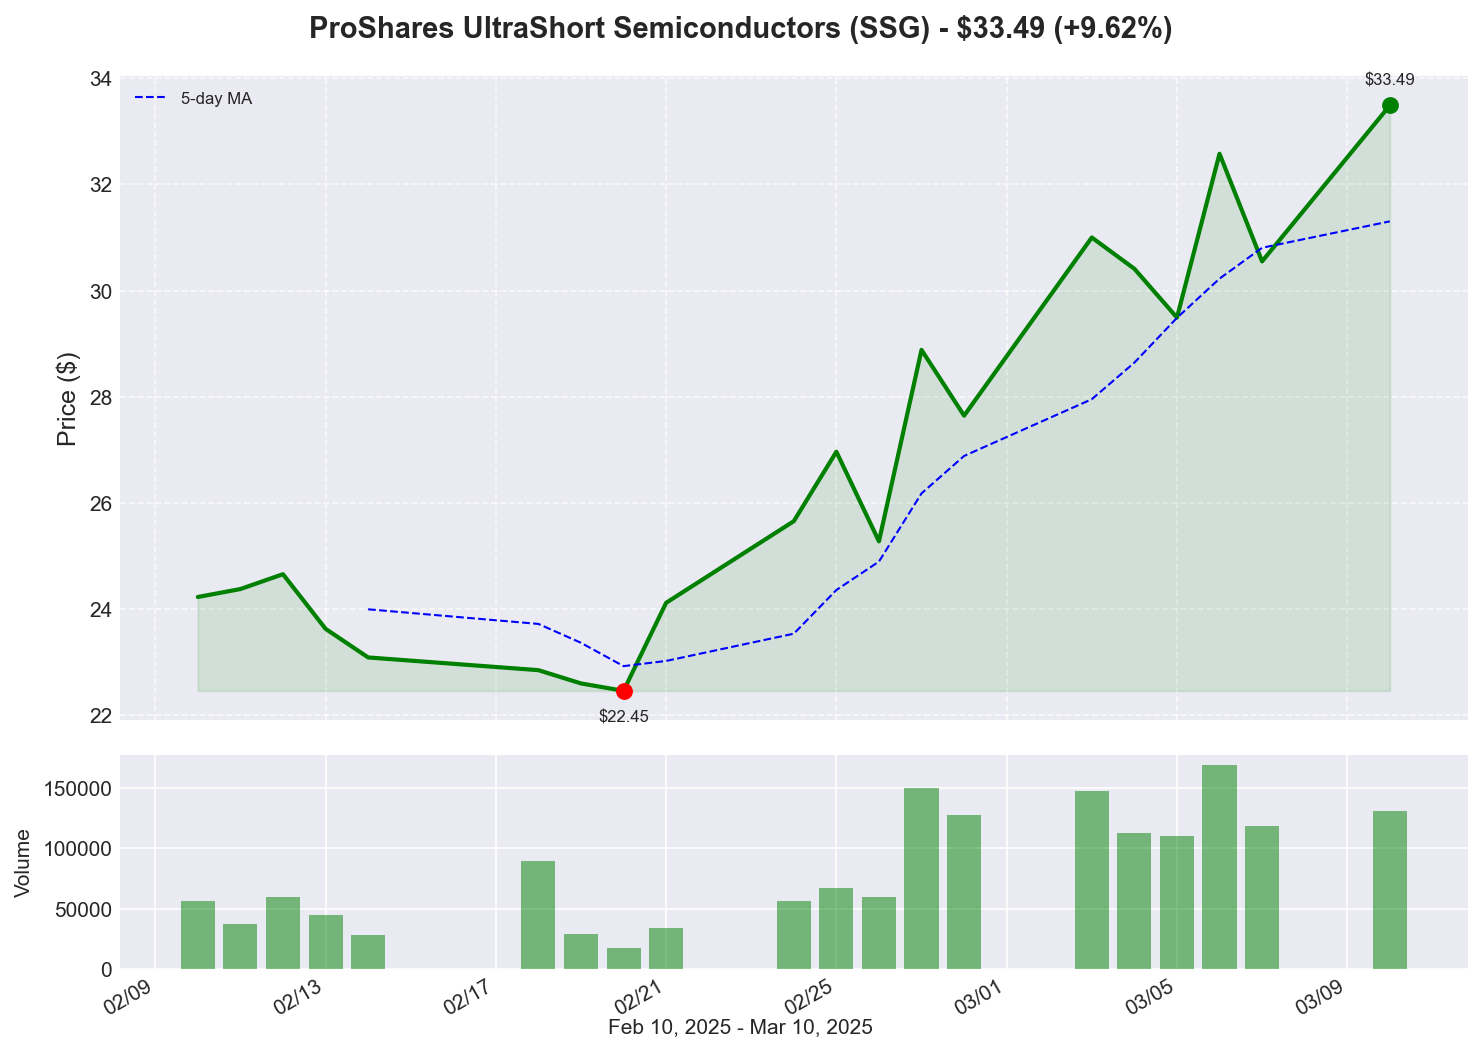
$33.49
+$2.94 (+0.00%)
Volume: 0
Sector: N/A
Industry: N/A
Price Chart
Technical Indicators
Moving Averages
50-Day MA: N/A
200-Day MA: N/A
Relative Strength Index (RSI)
RSI (14): N/A
Support & Resistance
Support: $N/A
Resistance: $N/A
52-Week Range
High: $N/A
Low: $N/A
Fundamental Data
Market Cap
N/A
P/E Ratio
N/A
EPS
$N/A
Beta
N/A
Analysis
Note: The analysis provided below is generated for informational purposes only and should not be considered as financial advice. Always conduct your own research and consult with a qualified financial advisor before making investment decisions.
4. ProShares UltraShort Semiconductors (SSG) - Up 9.62%
Similar to AIBD, SSG is a leveraged inverse semiconductor ETF that rises when semiconductor stocks fall. The 9.62% gain indicates a significant drop in semiconductor stocks today. Given SSG's 21.16% weekly gain, there appears to be growing pessimism toward semiconductor valuations. This could be linked to concerns about chip oversupply, slowing demand in certain categories, or geopolitical tensions affecting global supply chains. The parallel movement with AIBD suggests a related causal factor affecting both AI and semiconductor companies, potentially tied to valuation concerns after extended bull runs in both sectors.Recent News
No recent news found for this stock.
Historical Performance
1 Day
N/A
1 Week
N/A
1 Month
N/A
3 Months
N/A
YTD
N/A
Historical Data
View this stock on other dates:
Recent News
No recent news found for this stock.