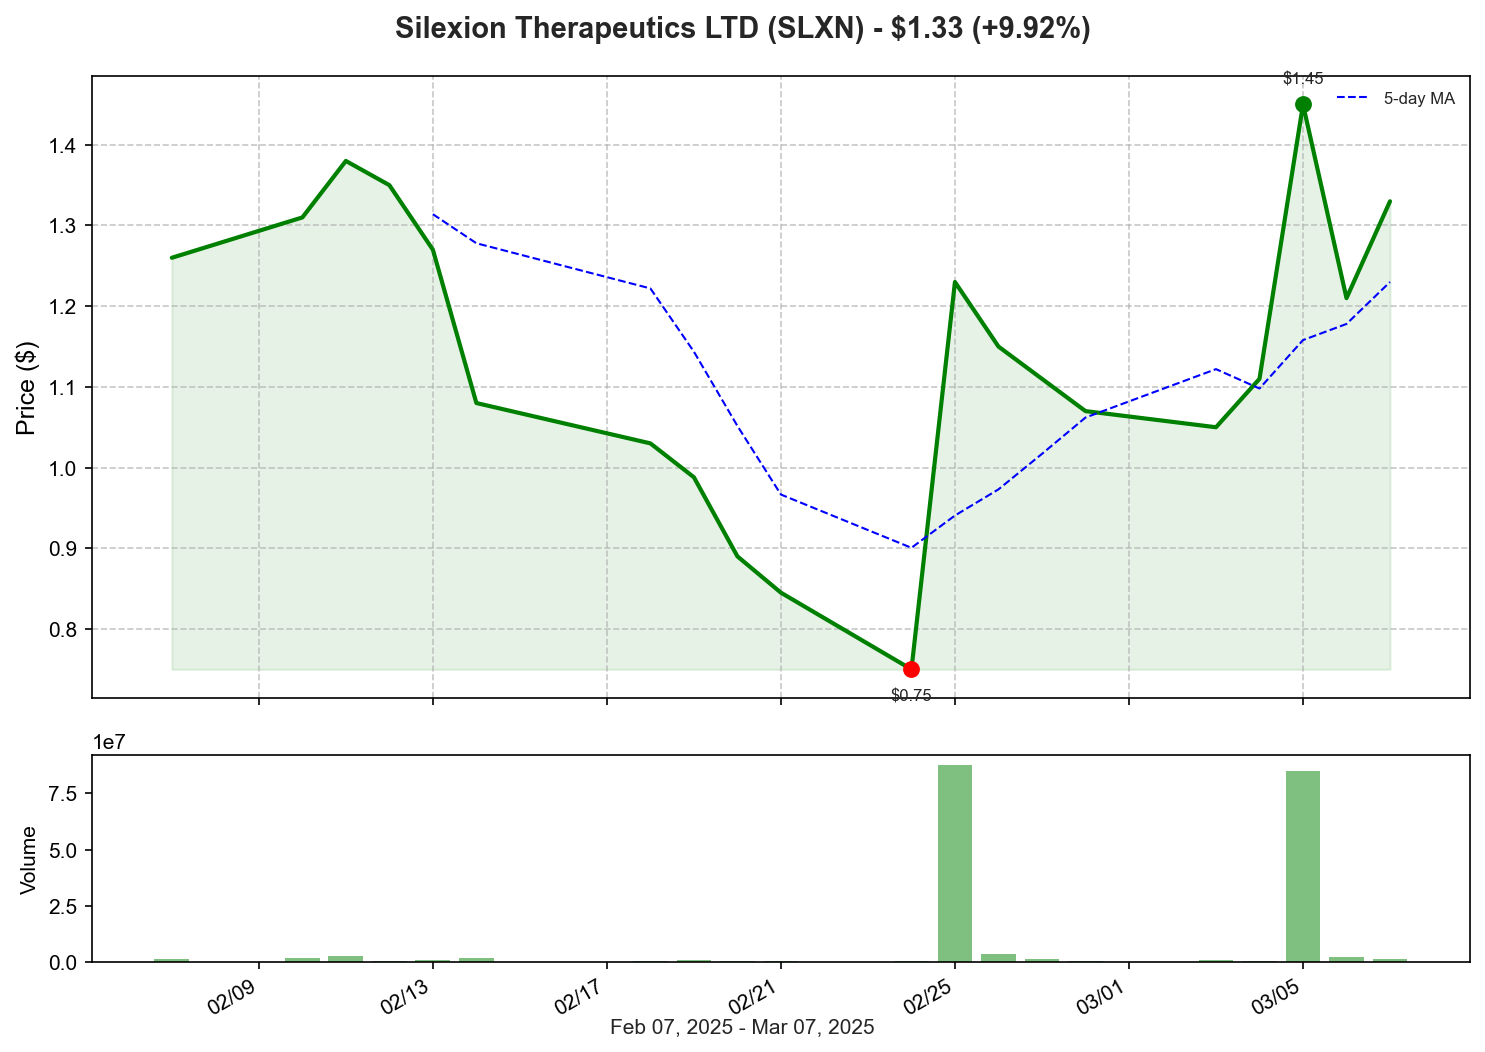
Silexion Therapeutics LTD (SLXN) Analysis

By Sophia Williams
Emerging Technologies Research Director, Ph.D.
Stock Overview
$1.33
+$0.12 (+0.00%)
Volume: 0
Sector: N/A
Industry: N/A
Price Chart
Technical Indicators
Moving Averages
50-Day MA: N/A
200-Day MA: N/A
Relative Strength Index (RSI)
RSI (14): N/A
Support & Resistance
Support: $N/A
Resistance: $N/A
52-Week Range
High: $N/A
Low: $N/A
Fundamental Data
Market Cap
N/A
P/E Ratio
N/A
EPS
$N/A
Beta
N/A
Analysis
Note: The analysis provided below is generated for informational purposes only and should not be considered as financial advice. Always conduct your own research and consult with a qualified financial advisor before making investment decisions.
1. Silexion Therapeutics LTD (SLXN) - Up 9.92%
Analysis: Silexion's substantial gain today extends its impressive weekly rally of nearly 20%, likely driven by the recent positive preclinical data for its pancreatic cancer candidate SIL204. The March 5th announcement of tumor reduction in orthotopic pancreatic cancer models represents a significant milestone for this small biotech company. Context: With pancreatic cancer being one of the most lethal and treatment-resistant cancers, successful preclinical results typically generate strong market interest. The company's small market cap (approximately $11.2 million) makes it particularly sensitive to positive developments. Investors appear to be pricing in the potential value of SIL204 as it moves closer to potential clinical trials, though the stock remains speculative given its early-stage pipeline.Historical Performance
1 Day
N/A
1 Week
N/A
1 Month
N/A
3 Months
N/A
YTD
N/A
Historical Data
View this stock on other dates: