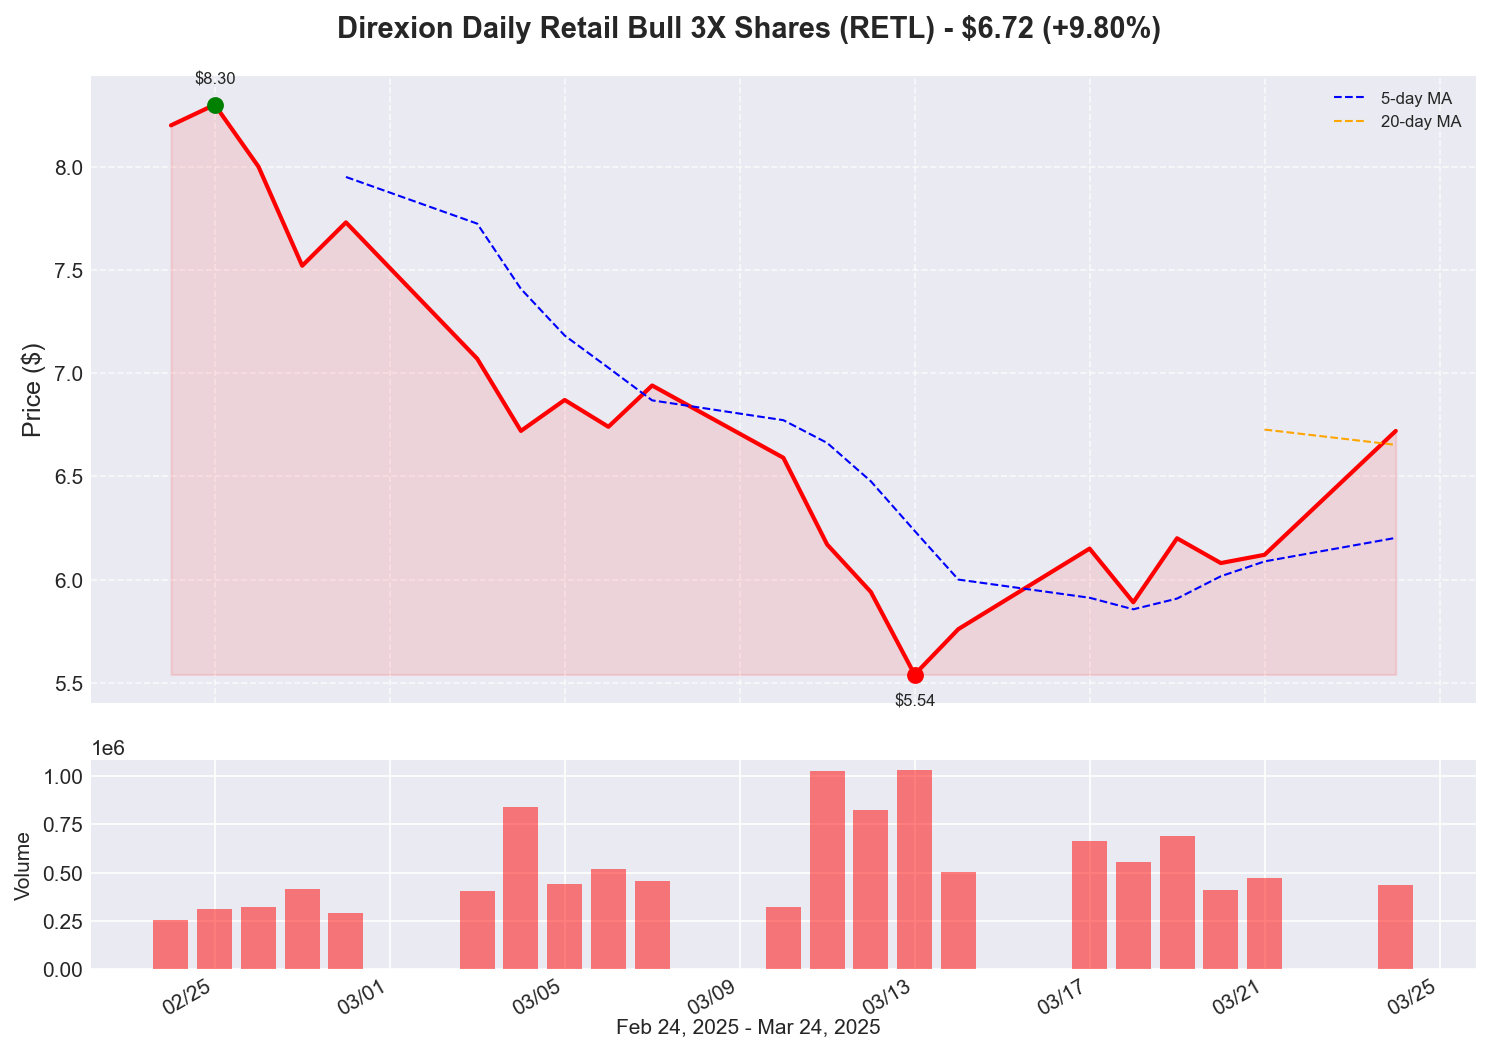
Direxion Daily Retail Bull 3X Shares (RETL) Analysis
Stock Overview
$6.72
+$0.60 (+0.00%)
Volume: 0
Sector: N/A
Industry: N/A
Price Chart

Technical Indicators
Moving Averages
50-Day MA: N/A
200-Day MA: N/A
Relative Strength Index (RSI)
RSI (14): N/A
Support & Resistance
Support: $N/A
Resistance: $N/A
52-Week Range
High: $N/A
Low: $N/A
Fundamental Data
Market Cap
N/A
P/E Ratio
N/A
EPS
$N/A
Beta
N/A
Recent News
No recent news found for this stock.
Historical Performance
1 Day
N/A
1 Week
N/A
1 Month
N/A
3 Months
N/A
YTD
N/A
Historical Data
Last updated: March 24, 2025