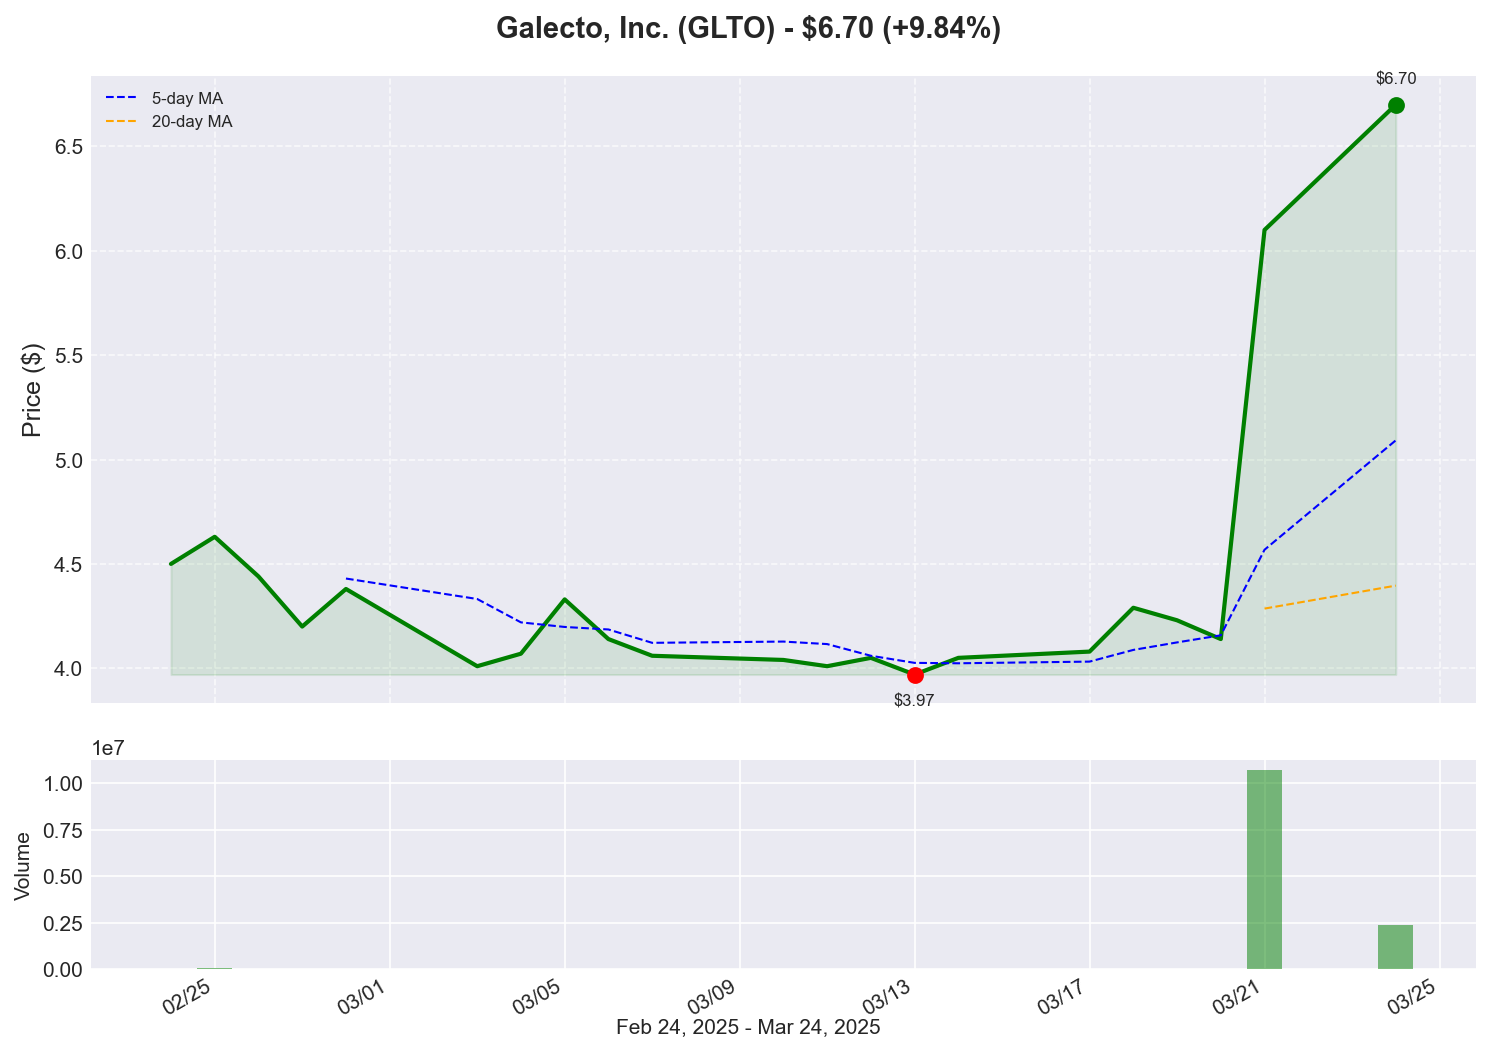
Galecto, Inc. (GLTO) Analysis
Stock Overview
$6.7
+$0.60 (+0.00%)
Volume: 0
Sector: N/A
Industry: N/A
Price Chart

Technical Indicators
Moving Averages
50-Day MA: N/A
200-Day MA: N/A
Relative Strength Index (RSI)
RSI (14): N/A
Support & Resistance
Support: $N/A
Resistance: $N/A
52-Week Range
High: $N/A
Low: $N/A
Fundamental Data
Market Cap
N/A
P/E Ratio
N/A
EPS
$N/A
Beta
N/A
Recent News
Galecto Reports Full-Year 2024 Financial Results
BOSTON, March 19, 2025 (GLOBE NEWSWIRE) -- Galecto, Inc. (NASDAQ: GLTO), a clinical-stage biotechnology company focused on the development of novel treatments for cancer and fibrosis, today announced its operating and financial results for the quarter and year ended December 31, 2024.
Read Full ArticleHistorical Performance
1 Day
N/A
1 Week
N/A
1 Month
N/A
3 Months
N/A
YTD
N/A
Historical Data
Last updated: March 24, 2025