Direxion Daily AI And Big Data Bear 2X Shares (AIBD) Analysis
Stock Overview
$18.6846
+$1.65 (+0.00%)
Volume: 0
Sector: N/A
Industry: N/A
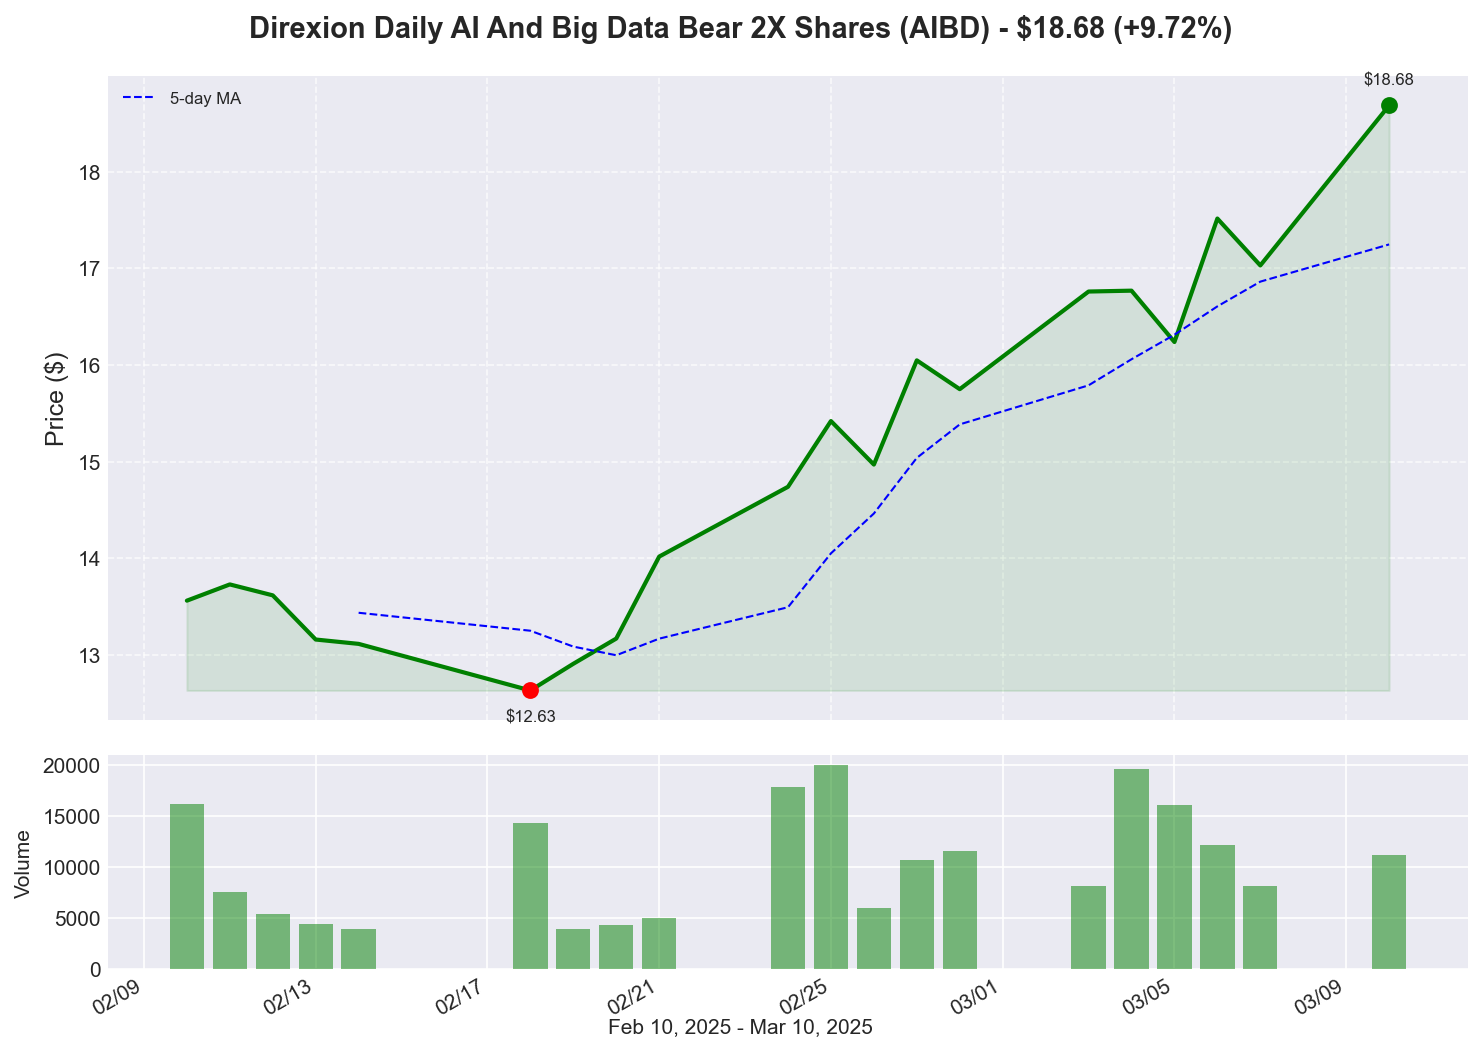
Price Chart
Technical Indicators
Moving Averages
50-Day MA: N/A
200-Day MA: N/A
Relative Strength Index (RSI)
RSI (14): N/A
Support & Resistance
Support: $N/A
Resistance: $N/A
52-Week Range
High: $N/A
Low: $N/A
Fundamental Data
Market Cap
N/A
P/E Ratio
N/A
EPS
$N/A
Beta
N/A
Analysis
Note: The analysis provided below is generated for informational purposes only and should not be considered as financial advice. Always conduct your own research and consult with a qualified financial advisor before making investment decisions.
3. Direxion Daily AI And Big Data Bear 2X Shares (AIBD) - Up 9.72%
This leveraged inverse ETF targets AI and big data companies, delivering twice the inverse daily performance of its underlying index. Today's gain signals significant weakness in the AI and big data sector. This reversal could reflect profit-taking in an overheated segment, concerns about AI company valuations, or potentially disappointing developments from major AI players. With an 18.63% gain over the past week, there appears to be a sustained correction in the AI space. This movement aligns with other inverse ETFs in the technology sector performing well today, suggesting a broader tech pullback rather than AI-specific concerns.Recent News
No recent news found for this stock.
Historical Performance
1 Day
N/A
1 Week
N/A
1 Month
N/A
3 Months
N/A
YTD
N/A
Historical Data
View this stock on other dates:
Recent News
No recent news found for this stock.